You can find the Jupyter Notebook for this project here. For access to the .csv file, which was too large to upload to Github, use the Contact form on my website.
OKCupid data? Okay!
As a millennial who spent a good portion of my 20’s on OKCupid, I was very excited for the opportunity to analyze and manipulate a dataset containing nearly 60,000 OKCupid profiles as my machine learning capstone project. Because my academic background is in linguistics, I was interested to see if the way that we speak about ourselves, our relationships, and the world around us could be used to predict information like education level, sexuality, or even age. After some deliberation, I decided to break the data down by sexuality. After all, I and most queer people I know have our identities firmly rooted in our queerness, and for good reason: to date, we still experience housing discrimination. Although job discrimination was ruled illegal by the Supreme Court this June, the existence of at-will employment still means that an employer can fire an LGBT+ employee for “not being a good fit,” “dress code violations,” or some other coded homo- and transphobic reason, something many of us have seen happen or even experienced firsthand. Our trans siblings are being murdered, denied healthcare, forced out of sports, and facing horrific treatment if incarcerated. Our queerness affects every facet of our lives.
Before moving onto my machine learning model, which was covered in Part Two of this project, I decided to visualize and analyze the data given to me. Very little of it surprised me, but I couldn’t help but feel more and more despondent the further along I got in the data. To accompany the following analyses, I am including what I hope are actionable steps and program ideas to lessen the health and income disparities faced by queer individuals.
Basic demographics
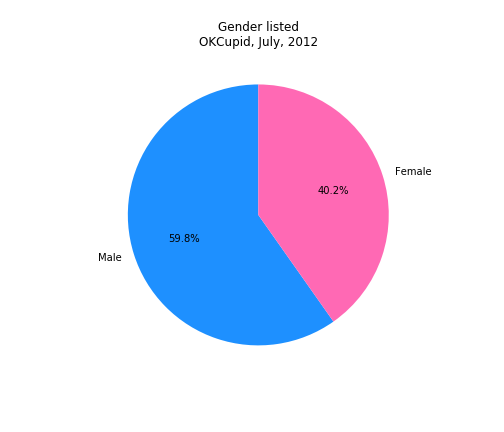
Gender
The OKCupid data provided included 59,946 profiles that were active between June, 2011 and July, 2012. The gender split, which was still binary at the time of data collection, was about a 60-40% split, favoring men.
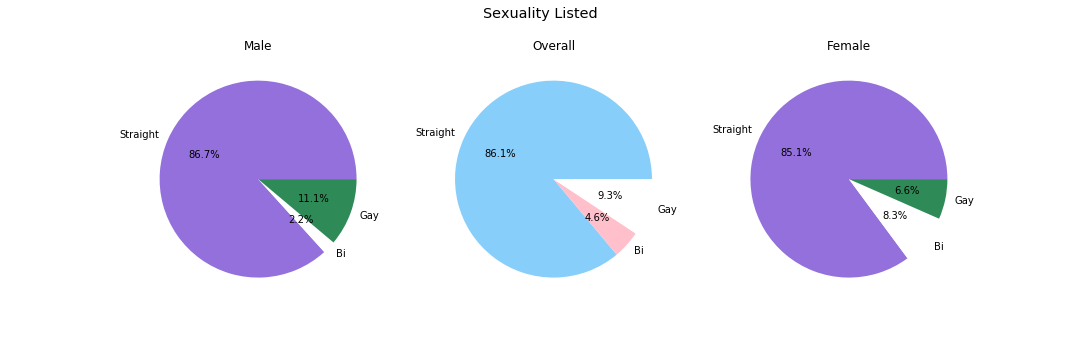
Sexuality
Like with the gender field, 2012 OKCupid’s sexuality options were much more limited than they are today. Users’ options were heterosexual, bisexual, and homosexual, which I will call straight, bi, and gay throughout this analysis.
Overall, 86.1% of users labeled themselves as straight, 4.6% labeled themselves as bi, and 9.3% labeled themselves as gay. At 8.3%, women were significantly more likely to label themselves as bi than men, of whom only 2.2% claimed a bi identity.
This tracks: while biphobia runs rampant regardless of gender, male bisexuality is seen as less socially acceptable. Thankfully, bi people across the gender spectrum are gaining social acceptance through media representation. We can now see unapologetically bi characters in popular television shows like Darryl Whitefeather in Crazy Ex Girlfriend and Rosa Diaz in Brooklyn 99.
 Darryl singing and dancing during his number, “Gettin Bi,” at the Crazy Ex Girlfriend reunion. Darryl singing and dancing during his number, “Gettin Bi,” at the Crazy Ex Girlfriend reunion. |
 Rosa answering a barrage of questions from her coworkers after coming out as bisexual. Rosa answering a barrage of questions from her coworkers after coming out as bisexual. |
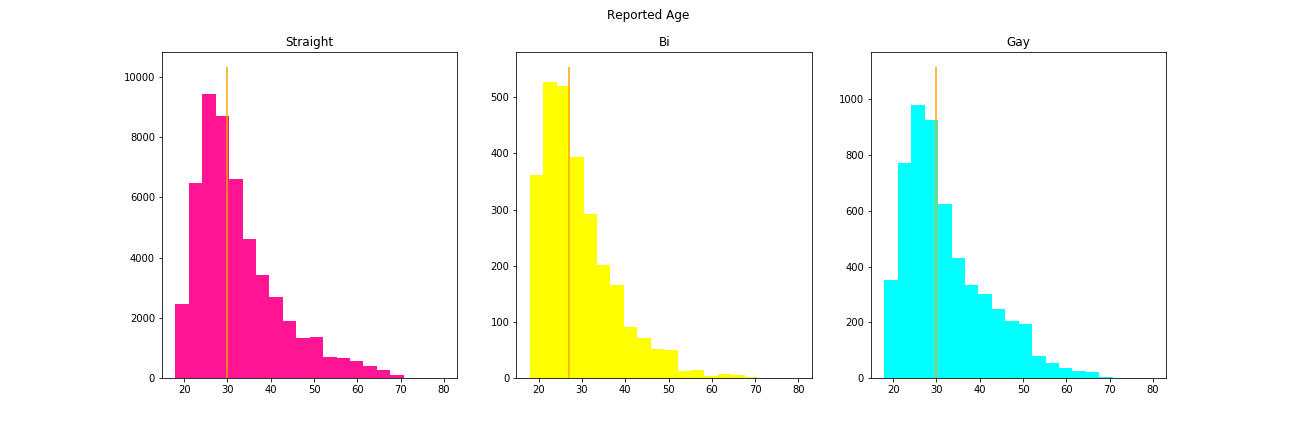
Age
The median age was 30, 27, and 30 years for straight, bi, and gay users respectively. Bi users tended to be slightly younger, with many aged around 18-20. All users saw a drop off in age around 50 years, but it was more dramatic for gay and bi users. This could have been a result of the AIDS crisis, since people in their 50’s at the time of data collection would have been in their early 20’s during the mid-1980’s.
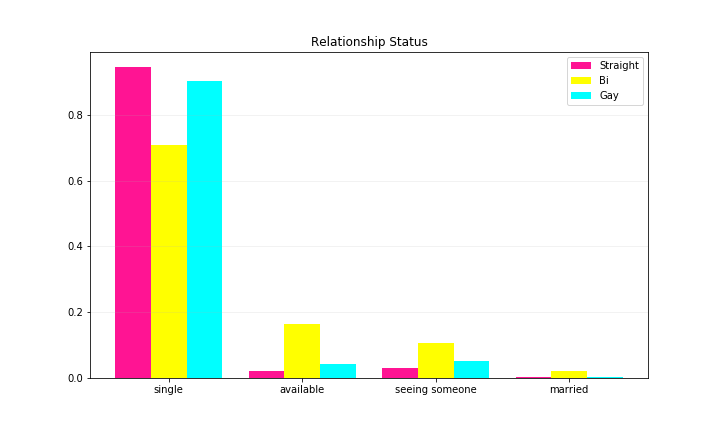
Relationship status
Most users were single. However, many bi– and some gay– users were listed as available, seeing someone, and married, suggesting nonmonogamy is more common for queer individuals than their straight counterparts.
Ethnicity and religion
Race
At the time of this project, the US census breaks down race like this:
| Race | Percent of US Population |
|---|---|
| White alone | 76.3 |
| Black or African American alone | 13.4 |
| American Indian and Alaska Native alone | 1.3 |
| Asian alone | 5.9 |
| Native Hawaiian and Other Pacific Islander alone | 0.2 |
| Two or More Races | 2.8 |
| Hispanic or Latino | 18.5 |
| White alone, not Hispanic or Latino | 60.1 |
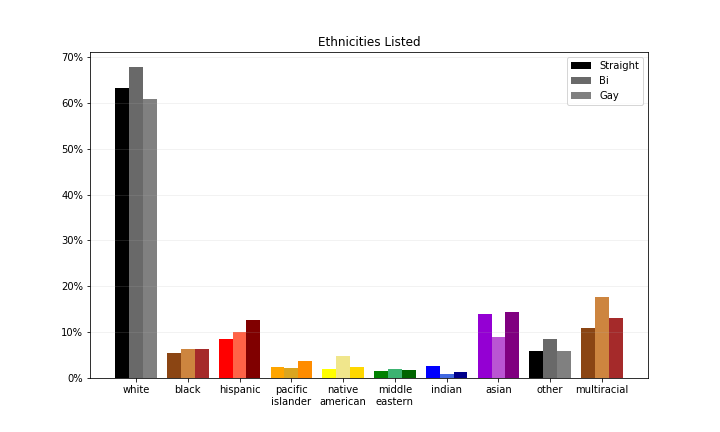
In contrast, this is the racial composition of the 2012 OKCupid data:
| Race | Straight | Bi | Gay |
|---|---|---|---|
| White | 63.2 | 67.7 | 60.8 |
| Black | 5.4 | 6.3 | 6.3 |
| Hispanic | 8.5 | 10.0 | 12.7 |
| Pacific Islander | 2.3 | 2.3 | 3.8 |
| Native American | 1.9 | 4.7 | 2.5 |
| Middle Eastern | 1.5 | 1.9 | 1.8 |
| Indian | 2.6 | 0.8 | 1.3 |
| Asian | 13.9 | 8.9 | 14.4 |
| Other | 5.8 | 8.6 | 5.8 |
| Multiracial | 10.9 | 17.6 | 13.2 |
Many races, especially black and latine users, seemed underrepresented by OKCupid when compared with US Census data. This could have something to do with the way OKCupid marketed itself at the time, presenting itself as a predominantly white space, or it could have something to do with the demographics of the geographic locations the data was collected from. Either way, when creating an online platform, it is crucial to market it as a safe space for people of color. A great read for anyone looking to expand their user base for a dating platform is Love’s Not Color Blind, by Kevin Patterson.
When it comes to sexuality, with the exception of asian and indian users, bi and gay users were more likely to be racial minorities than their straight counterparts. This could have something to do with precolonial non-white groups having their own cultural beliefs surrounding gender and sexual minorities and thus being more accepting of our identities.
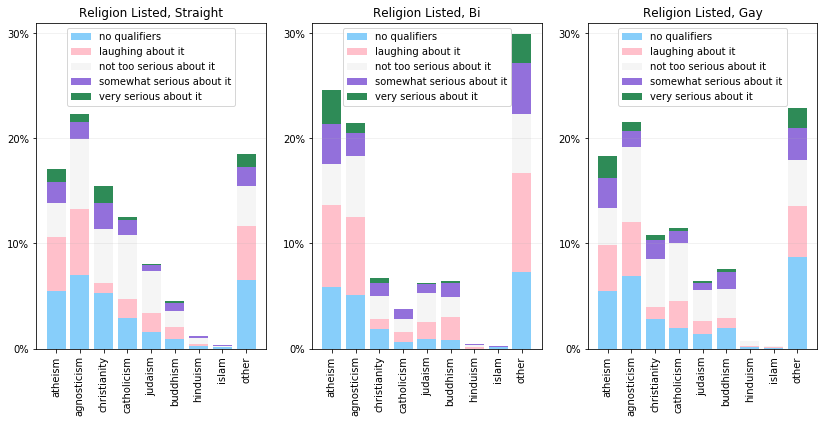
Religion
The religious makeup of users was interesting. Having spent a lot of time with fellow jewish queers, I honestly expected Judaism to dominate the bi and gay graphs. After all, we all put an orange on our seder plates to symbolize the fruitfulness that queer Jews bring to the table at the suggestion of Susannah Heschel. In contrast, Jewish users took a back seat to other religions for all three groups. Christianity and Catholicism were much more common among straight users than queer ones and bisexual users were primarily Atheist, Agnostic, or a religion not listed (and they were very serious about it, too!).
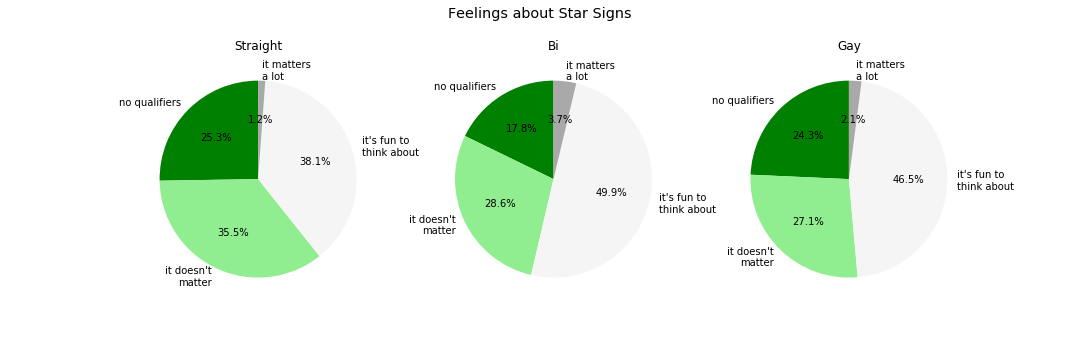
Astrology is often a hot topic in dating, but the discourse is more likely to be around its validity than prospective partners’ signs. It’s often practiced by queer people of color and women, groups whose interests and beliefs are frequently discounted as lesser. This debate is so pervasive that some people even use the question, “What’s your sign,” as a litmus test to determine if a partner will outright reject their beliefs or not. So, when visualizing the data, I was completely unsurprised that gay and bi users were two and three times more likely to say that astrology matters a lot than straight users and more likely to at least say that it’s fun to think about.
Education, Career, and Income
Education
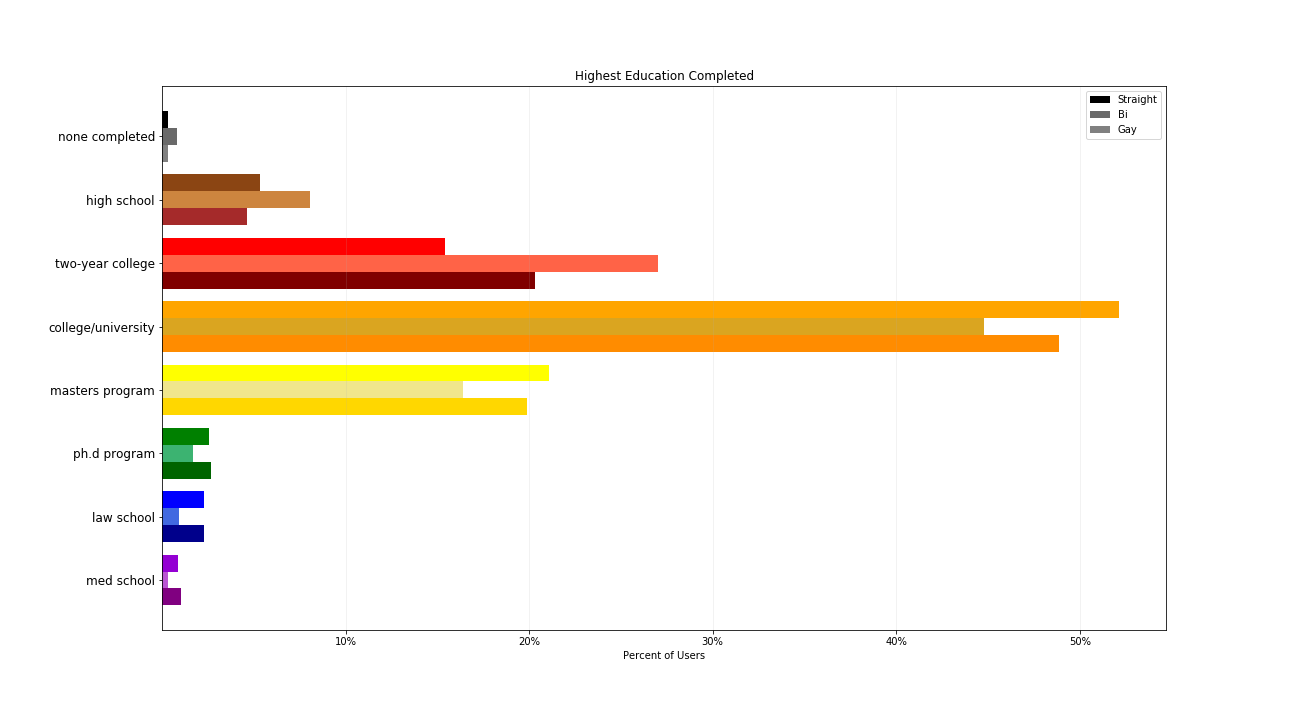
Bi users were much more likely than other users to have completed two-year college or less. Straight users were more likely than others to have completed a college/university education or a masters program. Gay users were all across the board. They were more likely than straight users to have stopped after completing two-year college or its equivalent, but also more likely than other users to have completed a Ph.D program, med school, or law school.
Although the education discrepancy could be explained away by age– remember how bi users skewed younger than straight and gay users?–, there has to be more to it than that. When I reenrolled in school to work towards a second bachelor’s degree, my engineering professor would begin rants directed at me with, “you people,” before going off on whatever I had done to displease him that time. It frustrated me and left me wondering which part of me he was you-peopling. Several interviewees in “Don’t Ask, Don’t Tell”: The Academic Climate for Lesbian, Gay, Bisexual, and Transgender Faculty in Science and Engineering, by D. Bilimoria and A. Stewart, confirmed that this is a common occurence in academia with one interviewee going on to say she has “the constant experience of wondering if things are occuring because of gayness or because of other factors.” Would that she were just imagining her coworkers’ homophobia: another interviewee confided that a mentor spoke of another person, “I think she’s a lesbian. I’d never trust her data.”
If academic faculty are being scrutinized, excluded, and told to minimize themselves because of their sexuality, we can fairly devise that their students are also on the receiving end of homophobia. So what can we do to fix that? Academic institutions need to implement and enforce zero tolerance policies against both overt and covert homophobia; panels, clubs, and other events sharing LGBT+ experiences should be held regularly; and LGBT+ material should not be limited to women’s and queer studies courses, rather it should be included in curriculae spanning all fields.
Career and Income
Users’ career paths were also affected by sexuality. “Other” was the most popular field for this metric, suggesting that many users either felt uncomfortable sharing their occupation or that they participated in nontraditional work. This is common among younger people, but is especially common among minorities, who are frequently unable to get, maintain, or progress within a traditional career. Sexual and gender minorities face unique obstacles in this regard. Since many LGBT+ individuals realize their identities later in life, this can disrupt Super’s life-span, life-space approach to career development: “growth, exploration, establishment, maintenance, and disengagement.” Julie Gedro, in their article LGBT Career Development, states “because of the energy that integrating a positive gay or lesbian identity requires, career development for gay people can be delayed, stalled or misdirected.”
At the same time, people with queer identities are often pidgeonholed into career paths stereotyped as queer or being dominated by the opposite gender, and usually not in a good way. Gedro states, “Traditional male occupations such as lawyer, doctor, and office manager are considered to be high in complexity, strength, and prestige and power; yet lesbians are stereotyped in occupations that are not prestigious nor require a college degree.” Likewise, gay men were reportedly “stereotyped as hairdressers, florists, dancers, actors, secretaries, nurses, flight attendants, and other female-dominated occupation.”
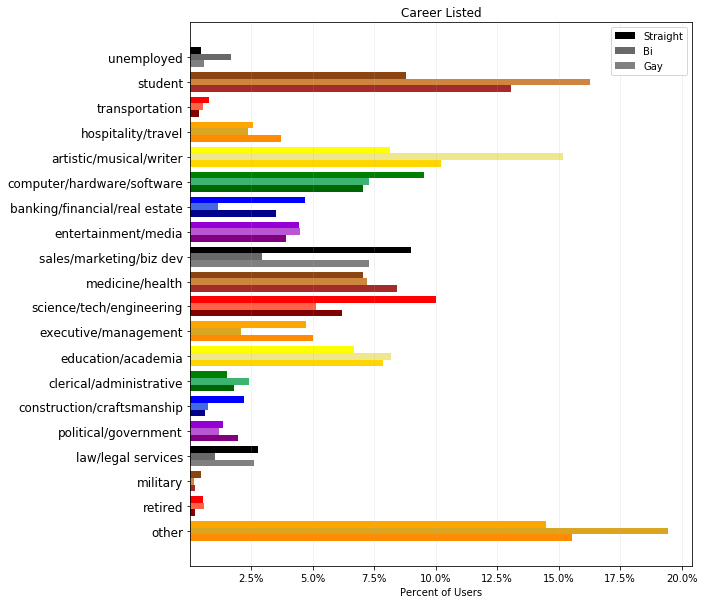
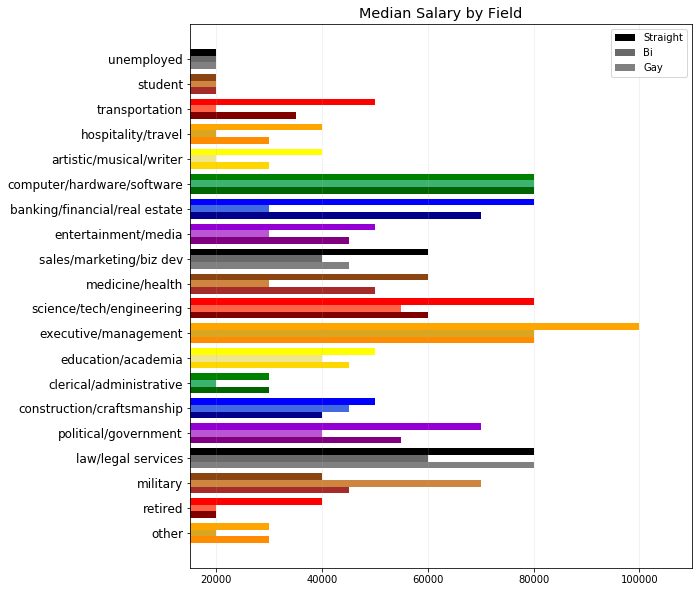
The OKCupid data supports Gedro’s findings. Besides “other” and “student,” the most commonly selected fields were science/tech/engineering, computer/hardware/software, and sales/marketing/biz dev; artistic/musical/writer, education/academia, and medicine/health; and artistic/musical/writer, medicine/health, and education/academia for straight, bi, and gay users, respectively. In all but computer/hardware/software, law/legal services, military, and other, straight users reported much higher salaries than their queer counterparts. It is also worth noting that bi users were several times more likely than either straight or gay users to report being unemployed and that bi users who reported themselves as being employed in other and artistic/musical/writer fields were reporting at a rate several percentage points higher than their straight and gay counterparts… while earning half the salary straight users reported.
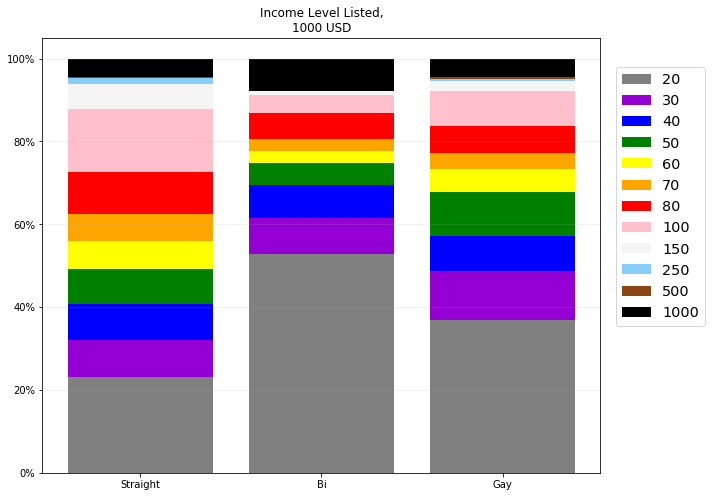
Following career specific data, it is only to be expected that general salary data also shows an income disparity between straight and queer users. More than 50% of bi users reported making $20,000 or less per year, the lowest available income bracket on OKCupid. Straight users at the same percentile reported making three times that at $60,000 and gay users reported making $40,000. Although many bi users reported making $1,000,000 per year, further investigation showed that users were largely using the high salary as a way to avoid disclosing income. One user, who described themself as “hot polycephalic children in the city runnin’ wild, lookin’ pretty,” reportedly made millions working for the military after graduating from med school at the ripe, old age of 22.
What can we do to lessen income disparities and encourage inclusivity across fields? Gedro highlights the need for further research on LGBT+ issues faced regarding human resource development, LGBT+ aware and educated human resource professionals and supervisors, and implementation of “practice to interrupt the inequities created by intolerance and invisibility of LGBT people.” I, personally, would venture to suggest that high school and college counselors also receive education on LGBT+ issues and their impact on career and income. This is all, however, tricky considering recent events: Donald Trump’s Executive Order on Combating Race and Sex Stereotyping makes it nearly impossible for any federally funded employer to receive and provide diversity training vital to lessening the career and income disparities faced by racial, gender, and sexual minorities. Beyond pushing back against regressive policies like this one, I fear that the best we can do is highlight successful queer people in straight-dominated fields.
Lifestyle
Substance Use
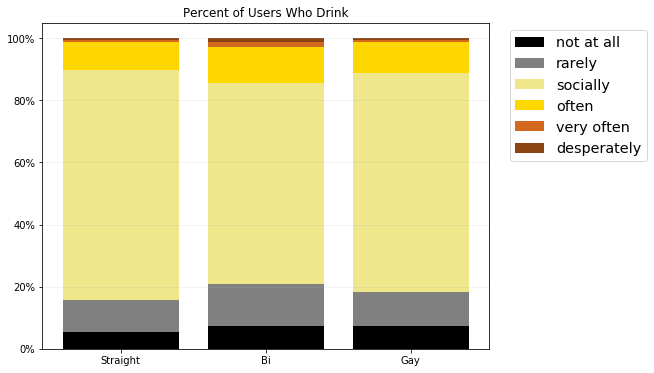
When it comes to alcohol, queer users were ever so slightly more likely to abstain from drinking than straight users and bi users were a tiny bit more likely than straight or gay users to drink often, very often, or desperately. While most users across the board stated that they drank socially, it’s incredibly important to keep in mind that the extent of social drinking is highly subjective. Recently, many people were shocked to find out that liquor stores were considered essential businesses during the pandemic. Addiction experts understood that many people who consumed alcohol socially or to unwind at the end of a long day were more dependent on the substance than they previously believed.
While nearly 85% of straight users stated that they either did not smoke or were trying to quit, only about 80% of gay users and 70% of bi users could say the same. In fact, nearly 20% of bi users said they smoked either regularly or when drinking.

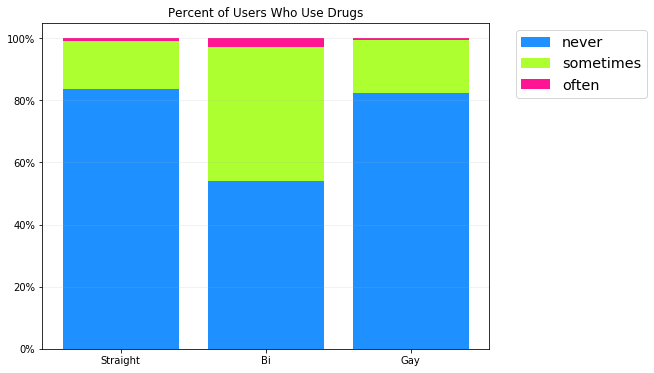
Drug use was the most dramatically different between bi users and their gay and straight counterparts. Nearly half of bi users said they used drugs, compared to less than 20% of straight and gay users. Bi users were also more than twice as likely as straight or gay users to state they used drugs often.
There are a variety of reasons that queer individuals use substances at higher rates than straight people. In his article, The LGBTQ Community and Addiction, Jeffrey Juergens states, “Oftentimes, LGBTQ individuals will turn to drugs or alcohol as a way to self-medicate from the prejudice they face in everyday society.” We already know that sexual and gender minorities face discrimination that affects our education, career, and income, so it doesn’t take mental gymnastics to understand that this bleeds into other facets of queer life. Longer hours worked at a job where we may or may not have the ability to be out, less pay leading to unstable housing in a food desert, harassment online and in person, rejection from family members, and internalized homophobia can all contribute to mental health issues that make self-medicating incredibly attractive. Add onto this legal medical discrimination and the high cost of medical care and you have the perfect storm for addiction.
Long-term drug use is linked to cardiovascular disease, respiratory problems, kidney damage, and liver disease. While some drugs, like marijuana, don’t kill us outright, queer people are 9.5 times more likely to use heroin than our straight counterparts. Queer people’s coping mechanisms to get through discrimination and violence are killing us.
There is hope, though. As addictions awareness rises, more and more LGBT-specific addictions groups, counselors, and rehabilitation centers are becoming available. Addiction No More’s website lists ten queer-specific addictions groups in Maryland alone. We need to keep up this momentum and make risk-aware, non-judgmental information on substance use, as well as safe injection sites and more rehabilitation centers, accessible– for free– in both rural and urban areas across the country.
Body Type
The final category that I decided to analyze was body type. Users had the option of categorizing their body type as anything from “used up” to “jacked.” Straight users were the most likely to have a positive body image, with nearly 50% describing themselves as “fit,” “athletic,” or “jacked.” Gay users seemed more middle-of-the-road, with half of their users opting for “a little extra,” “average,” or “thin.” Bi users, on the other hand, were the most likely to categorize themselves as “used up,” “overweight,” “full figured,” “curvy,” or “a little extra.”

These statistics are telling. On the one hand, queer people–especially queer youth– are at higher risk for disordered eating. According to the National LGBT Health Education Center’s Addressing Eating Disorders, Body Dissatisfaction, and Obesity Among Sexual and Gender Minorities, 14-42% of young men with eating disorders are sexual or gender minorities and young queer women are 3-4 times as likely to engage in excessive weight-control behaviors than their straight, cisgender counterparts. On the other hand, decreased activity levels and stress lead to weight gain. Young queer people are, by and large, fighting against their own bodies to try and impose both their own and society’s ideals upon them.
Combatting this phenomenon will take a lot of work. It means creating safe spaces for queer people to practice physical fitness, educating parents and medical professionals on health issues unique to queer people, removing barriers to medical care, and allowing queer youth to express their identities on their terms so they do not feel the need to control their weight so rigidly.
Conclusion
Queer people face severe educational, income, and health disparities when compared to our straight peers. Our identities follow us wherever we go, whether we remain closeted or elect to come out at every turn. Bilimoria and Stewart cited queer educators who felt the need to be loudly out in order to act as a beacon of safety and inclusion for their students, as well as the price they paid in “rumors, a higher level of evaluation, and a suspicion that they had ‘hidden agendas.’” It’s easy, examining this data juxtaposed with more recent news, to begin to feel hopeless. We can’t let that happen, though. I feel truly grateful for the opportunity to examine this dataset and hope that this post can be used as both a beacon of safety and a call to action. We must keep pushing for positive change so we can move towards a better future for us all.